Applications/CellBoundaryExtractor2D: Difference between revisions
No edit summary |
(→Usage) |
||
| Line 29: | Line 29: | ||
* install MiToBo by following the instructions on the [[Installation]] page<br> | * install MiToBo by following the instructions on the [[Installation]] page<br> | ||
<!-- | |||
<span style="color:#ff0000"> '''Important note:'''<br> the CellBoundaryExtractor2D operator relies for Dijkstra gap closing on version 1.2.0 of the external '''JGraphT''' library.<br> Fiji by default ships with an older version of this library which causes incompatibilites. To avoid breaking Fiji installations by activating MiToBo's update site we currently do not distribute the JGraphT library via our update site.<br> | <span style="color:#ff0000"> '''Important note:'''<br> the CellBoundaryExtractor2D operator relies for Dijkstra gap closing on version 1.2.0 of the external '''JGraphT''' library.<br> Fiji by default ships with an older version of this library which causes incompatibilites. To avoid breaking Fiji installations by activating MiToBo's update site we currently do not distribute the JGraphT library via our update site.<br> | ||
To use the CellBoundaryExtractor2D you need to manually install the jar:</span> | To use the CellBoundaryExtractor2D you need to manually install the jar:</span> | ||
| Line 34: | Line 35: | ||
* <span style="color:#ff0000"> Download the new jar ''jgrapht-core-1.2.0.jar'' from [http://central.maven.org/maven2/org/jgrapht/jgrapht-core/1.2.0/jgrapht-core-1.2.0.jar here].</span> | * <span style="color:#ff0000"> Download the new jar ''jgrapht-core-1.2.0.jar'' from [http://central.maven.org/maven2/org/jgrapht/jgrapht-core/1.2.0/jgrapht-core-1.2.0.jar here].</span> | ||
* <span style="color:#ff0000"> Copy the jar into the folder ''jars'' of your local Fiji installation and start Fiji again.</span> | * <span style="color:#ff0000"> Copy the jar into the folder ''jars'' of your local Fiji installation and start Fiji again.</span> | ||
--> | |||
Afterwards the CellBoundaryExtractor2D can be invoked as follows: | Afterwards the CellBoundaryExtractor2D can be invoked as follows: | ||
* run MiToBo and start the operator runner by selecting the menu item '''''MiToBo Runner''''' from '''''Plugins -> MiToBo''''' | * run MiToBo and start the operator runner by selecting the menu item '''''MiToBo Runner''''' from '''''Plugins -> MiToBo''''' | ||
Latest revision as of 14:25, 5 March 2019
Cell Boundary Extractor 2D
The Cell Boundary Extractor 2D is available since release version 1.8.13.1 of MiToBo.
This operator aims to extract cell boundaries from microscope images with fluorescently-labeled cell membranes using vesselness enhancement filters.
For manual post-processing of sub-optimal segmentation outcomes you may take a look at our interactive label image editor.
Latest News
The CellBoundaryExtractor2D Plugin has been released in MiToBo and MiToBo-Plugins 1.8.13.1.
Related Publications
- B. Möller and K. Bürstenbinder,
"Semi-automatic Cell Segmentation from Noisy Image Data for Quantification of Microtubule Organization on Single Cell Level".
In Proc. of IEEE International Symposium on Biomedical Imaging (ISBI '19), Venice, Italy, April 2019, accepted.
Name of Plugin/Operator
de.unihalle.informatik.MiToBo.apps.cells2D.CellBoundaryExtractor2D
(available since MiToBo version 1.8.13.1)
Main features
- automatic extraction of fluorescently-labeled cell membranes
- gap closing based on Dijkstra shortest path techniques
Usage
To run the CellBoundaryExtractor2D perform the following steps:
- install MiToBo by following the instructions on the Installation page
Afterwards the CellBoundaryExtractor2D can be invoked as follows:
- run MiToBo and start the operator runner by selecting the menu item MiToBo Runner from Plugins -> MiToBo
- in the selection menu navigate to 'de.unihalle.informatik.MiToBo.apps.cells2D' and select the operator CellBoundaryExtractor2D
This will bring up the operator window of the CellBoundaryExtractor2D.
- Input data:
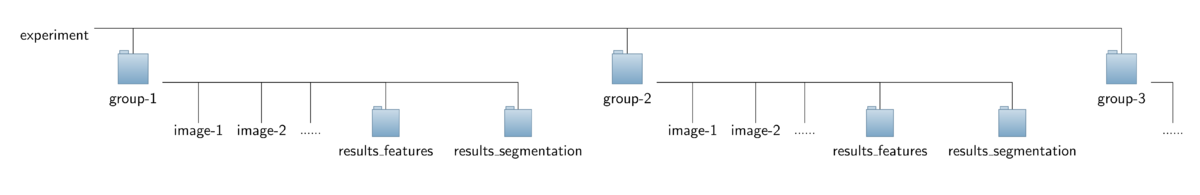
To ease interplay with the CytoskeletonAnalyzer2D the operator expects a special organization of the input image data which is outlined in the figure below. All the data should be contained in a common top-level folder, here named "experiment".
The images of different sub-groups (treatments/genotypes/proteins) should be found in separate sub-folders of this top-level folder, here named "group-1", "group-2" and so on. Note that the sub-folders named "results_features" can savely be ignored and don't have to be present for running the CellBoundaryExtractor2D. They will lateron be added by the CytoskeletonAnalyzer2D.
- Output data:
The operator generates for each image a label image with extracted cell regions as well as a file of cell boundaries in ImageJ ROI format. These files are stored in a new sub-folder termed "results_segmentation" in the sub-folder of each group. This way the output of the CellBoundaryExtractor2D can directly be specified as input for the CytoskeletonAnalyzer2D.
Optionally, by checking the Option Show/save additional results? in the GUI additional images of intermediate results can be generated listed in the table below (<imageID> denotes the name of a given input image without ending).
| Output File Name | Description |
| <imageID>-label.tif | Label image of extracted cell regions. |
| <imageID>-allRois.zip | ImageJ ROIs of extracted cell boundaries. |
| <imageID>-vessels.tif | Visualization of the vesselness map. |
| <imageID>-vessels-binarized.tif | Binarized vesselness map after applying Niblack thresholding. |
| <imageID>-vessels-binarized-filtered.tif | Binarized vesselness map after filtering of, e.g., too small components. |
| <imageID>-skeleton-initial.tif | Image of initial boundary skeleton after vesselness filtering and binarization. |
| <imageID>-skeleton-final.tif | Image of final boundary skeleton after post-processing and gap closing. |
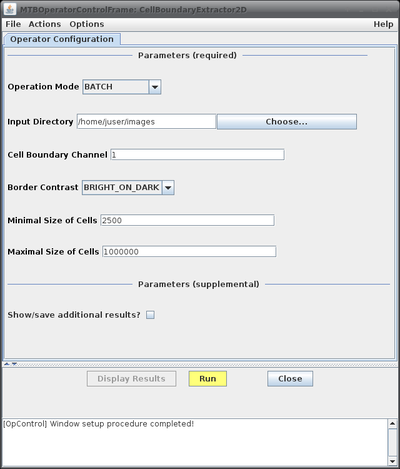
- Configuration Parameters:
| Parameter Name | Possible Values | Description |
| Operation Mode | BATCH | Basic processing mode: - BATCH: process all images in the sub-folders of the given top level folder - SINGLE_IMAGE: process the currently active image only |
| SINGLE_IMAGE | ||
| Input Directory/Image | Top-level folder containing sub-folders of all image groups to segment or input image name, respectively. | |
| Cell Boundary Channel | Channel with the fluorescently-labeled cell membranes. | |
| Border Contrast | ||
| BRIGHT_ON_DARK | Appearance of cell boundaries in images: - BRIGHT_ON_DARK: boundaries are brighter than the background - DARK_ON_BRIGHT: boundaries are darker than the background | |
| DARK_ON_BRIGHT | ||
| Minimal Size of Cells | Minimal size of cells, cells below this threshold are deleted. | |
| Maximal Size of Cells | Maximal size of cells, cells above this threshold are deleted. | |
| Show/save additional results? | Enables or disables display or storage, respectively, of additional intermediate results. |
Updates
January 2019
- Released first official version of CellBoundaryExtractor2D in MiToBo/MiToBo plugins 1.8.13.1.