Applications/CellBoundaryExtractor2D
From MiToBo
Jump to navigationJump to search
Cell Boundary Extractor 2D
The Cell Boundary Extractor 2D is available since release version 1.8.13.1 of MiToBo.
This operator aims to extract cell boundaries from microscope images with fluorescently-labeled cell membranes using vesselness enhancement filters.
For manual post-processing of sub-optimal segmentation outcomes you may take a look at our interactive label image editor.
Latest News
The CellBoundaryExtractor2D Plugin has been released in MiToBo and MiToBo-Plugins 1.8.13.1.
Related Publications
- B. Möller and K. Bürstenbinder,
"Semi-automatic Cell Segmentation from Noisy Image Data for Quantification of Microtubule Organization on Single Cell Level".
In Proc. of IEEE International Symposium on Biomedical Imaging (ISBI '19), Venice, Italy, April 2019, accepted.
Name of Plugin/Operator
de.unihalle.informatik.MiToBo.apps.cells2D.CellBoundaryExtractor2D
(available since MiToBo version 1.8.13.1)
Main features
- automatic extraction of fluorescently-labeled cell membranes
- gap closing based on Dijkstra shortest path techniques
Usage
To run the CellBoundaryExtractor2D perform the following steps:
- install MiToBo by following the instructions on the Installation page
- run MiToBo and start the operator runner by selecting the menu item MiToBo Runner from Plugins -> MiToBo
- in the selection menu navigate to 'de.unihalle.informatik.MiToBo.apps.cells2D' and select the operator CellBoundaryExtractor2D
This will bring up the operator window of the CellBoundaryExtractor2D.
- Input data:
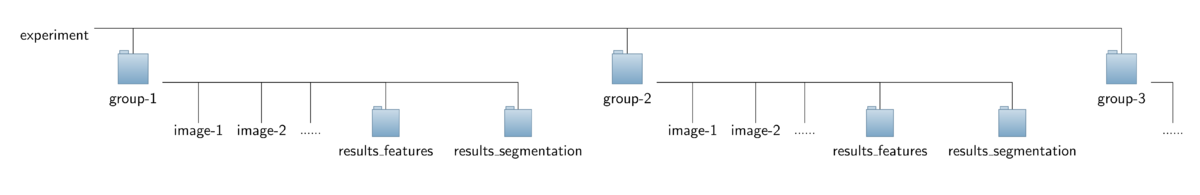
The operator expects a special organization of the input image data which is shown in the figure below. All the data should be contained in a common top-level folder, here named "experiment".
The images for each treatment/genotype/protein have to be put into separate sub-folders of this top-level folder, here named "group-1", "group-2" and so on. Besides the set of corresponding images,
each sub-folder is required to contain an additional sub-folder named "results_segmentation" where the annotation files with the cell areas or boundaries, respectively, are stored.
- For each image named "<imagename>.tif" a corresponding mask file is expected to be found in that folder. The mask file should have the same basename like the corresponding image file,
but either end on "-mask.tif" (e.g., "<imagename>-mask.tif") in case of using label images as masks, or on "-mask.zip" or "-mask.roi" (e.g., "<imagename>-mask.zip"), respectively, in case of using region sets as mask data.
Note that the operator currently only accepts ImageJ 1.x ROI sets as input. If label images are used as segmentation masks, the labels of individual cells in the label images are used as unique identifiers for the cells, i.e.,
are used as labels in the various plots. If the segmentation data is given in terms of ROIs a unique identifier is derived from the order of the cell boundaries in the ROI set.
Note that in the latter case a mask image is written to the output directory as additional output where the cells are marked by their identifiers to allow for easier assessment of the results.
Each of the sub-folders in the top-level folder is treated as a separate group of cells or experimental condition, thus, the cells of all images within one sub-folder are collected in a single set.
The names of the folders are used to label the different groups in the various output data files.
If the input images contain more than one channel you can select the channel on which the Cytoskeleton Analyzer should work. By default the first channel is used.
- Output data:
The operator generates image- or group-specific output data files as listed in the table below. All data files specific to a single input image are stored in a new sub-folder named "results_features" in the sub-folder of each group. All global output data files are stored directly in the top-level folder. The string imageID below represents the name of a single input image, the string groupID refers to a specific group. In addition to saving the output data to file bar charts and box-whisker plots are directly shown in the graphical user interface of ImageJ/Fiji upon termination of the analysis process.
| Output File Name | Where to find it... | Description |
| <imageID>-features.txt | folder results_features | Feature data for single image file. |
| <imageID>-features.tif | folder results_features | Image stack visualizing the feature data for single image. |
| <imageID>-clusterDistro.txt | folder results_features | Cluster distributions for each cell individually and for all cells in total of the image. |
| <imageID>-clusters.tif | folder results_features | Pseudo-colored image illustrating the cluster distribution per image. |
| <groupID>-distributionChart.png | folder results_features | Stacked bar plot of the cluster distribution for each cell of the group. |
| AllCellsClusterStats.txt | top-level folder | Cluster distribution of raw data for all images and cells. |
| AllCellsPCASubspaceStats.txt | top-level folder | If PCA is applied to the cluster distribution vectors this file contains the subspace feature vectors for all cells. |
| AllCellsDistanceData.txt | top-level folder | Matrix of pairwise normalized Euclidean distances between cluster distribution vectors of all cells. |
| AllGroupsDistanceData.txt | top-level folder | Matrix of pairwise normalized Euclidean distances between average cluster distribution vectors of all groups. |
| AllGroupsSimilarityNetworkData.txt | top-level folder | Similarity network suitable for import and visualization in Cytoscape. |
- Configuration Parameters:
| Parameter Name | Possible Values | Description |
| Image File Folder | Top-level folder containing data for all groups and experimental conditions of interest, respectively. | |
| Boundary File Format | LABEL_IMAGE | Format of the segmentation data files with cell boundary information: - LABEL_IMAGE: images with unique labels for each cell and a value of zero for the background - IJ_ROIS: set of ImageJ 1.x ROIs, one ROI for each cell |
| IJ_ROIS | ||
| Cytoskeleton Channel | Channel with the image data of the fluorescently labeled cytoskeleton. | |
| Calculate features | Activates the feature calculation, can be omitted if features have been extracted already. | |
| Feature Extractor | Feature operator to apply. | |
| Tile size | Tile size in x and y direction for the sliding window used for feature extraction. | |
| Tile shift | Tile shifts in x and y direction, i.e. pixel distance between subsequent positions of the sliding window. | |
| Number of feature clusters | Number of feature clusters applied in feature vector clustering. | |
| Do PCA in stage II? | Optionally, a principal component analysis (PCA) can be applied to the extracted cluster distribution vectors, and subsequent distance calculations can be restricted to the most significant principal components only. |
Updates
January 2019
- Released first official version of CellBoundaryExtractor2D in MiToBo/MiToBo plugins 1.8.13.1.