Applications/FeatureColorMapper: Difference between revisions
No edit summary |
|||
| Line 3: | Line 3: | ||
== FeatureColorMapper Plugin == | == FeatureColorMapper Plugin == | ||
[[File:Screenshot-FeatureColorMapper.png|500px|right|link=]] | |||
<!-- | |||
[[File:sampleImage-colorResult-inverse.png|300px|right|link=]] | |||
[[File:sampleImage-features-white.png|300px|right|link=]] | |||
--> | |||
==== Short Description ==== | ==== Short Description ==== | ||
The FeatureColorMapper allows to map feature values extracted for regions in an image onto corresponding label images for visualization.<br> The features values (like for example extracted by the '''''[[Applications/PaCeQuantToolset|PaCeQuant]]''''' plugin) have to be provided as CSV files.<br> The mapper allows to select a set of features, and for each feature color maps with user-defined colors showing the overlay of region-specific feature values over the image regions are saved to disk.<br/> | The FeatureColorMapper allows to map feature values extracted for regions in an image onto corresponding label images for visualization.<br> The features values (like for example extracted by the '''''[[Applications/PaCeQuantToolset|PaCeQuant]]''''' plugin) have to be provided as CSV files.<br> The mapper allows to select a set of features, and for each feature color maps with user-defined colors showing the overlay<br/> of region-specific feature values over the image regions are saved to individual folders on disk.<br/> | ||
==== Release Notes ==== | ==== Release Notes ==== | ||
The FeatureColorMapper is available in MiToBo since release version 1.8.17.<br/> | The FeatureColorMapper is available in MiToBo since release version 1.8.17.<br/> | ||
==== Related Publication ==== | ==== Related Publication ==== | ||
When using | When using the mapper, please cite us: | ||
* B. Möller, M. Glaß, D. Misiak, and S. Posch, ''MiToBo - a toolbox for image processing and analysis''. In Journal of Open Research Software, 4(1):e17, 2016. | * B. Möller, M. Glaß, D. Misiak, and S. Posch, ''MiToBo - a toolbox for image processing and analysis''. In Journal of Open Research Software, 4(1):e17, 2016. | ||
==== Name of Plugin/Operator ==== | ==== Name of Plugin/Operator ==== | ||
| Line 31: | Line 29: | ||
==== Main features ==== | ==== Main features ==== | ||
* allows to map region features, for example cell features extracted by [[Applications/PaCeQuant|PaCeQuant]], in heatmap style to image regions | * allows to map region features, for example cell features extracted by '''''[[Applications/PaCeQuant|PaCeQuant]]''''', in heatmap style to image regions | ||
* the color map can be configured by the user in terms of colors used for minimal and maximal values | * the color map can be configured by the user in terms of colors used for minimal and maximal values | ||
* multiple features can be mapped in a single plugin run | * multiple features can be mapped in a single plugin run | ||
* a range of valid region sizes can be specified to exclude too small or too large regions from processing and mapping | * a range of valid region sizes can be specified to exclude too small or too large regions from processing and mapping | ||
==== Usage | ==== Usage ==== | ||
To run the plugin perform the following steps: | To run the plugin perform the following steps: | ||
* install MiToBo by following the instructions on the [[Installation]] page | * install MiToBo by following the instructions on the [[Installation]] page | ||
* ... | * run MiToBo and start the operator runner by selecting the menu item '''''MiToBo Runner''''' from '''''Plugins -> MiToBo''''' | ||
* in the selection menu navigate to '''de.unihalle.informatik.MiToBo.apps.cellMorphology''' and select the operator '''''FeatureColorMapper''''' | |||
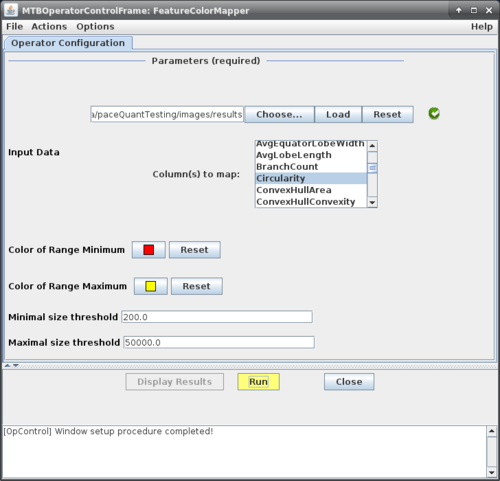
This will bring up the operator window of the mapper (see figure on the right, top) where the basic configuration parameters can be specified. | |||
===== Input Parameters ===== | You first need to select a folder where the mapper can find feature data that should be mapped. Select the folder using the '''Choose...''' button. After selecting a suitable directory, press the '''Load''' button . The mapper will search for files with CSV feature data and parse the first of these files to figure out which features are present. These will be listed in the '''Column(s) to map''' menu below and can be selected for mapping by the user. <br/> Once the desired features are selected you can specify the color range that should be used and minimal and maximal size thresholds for regions to be considered.<br/> Press the '''Run''' button to start the operator. | ||
====== Input Parameters ====== | |||
{|class="wikitable" | {|class="wikitable" | ||
|style="width:20%;"| | |style="width:20%;"| '''Parameter Name''' | ||
| | | '''Explanation''' | ||
|- | |- | ||
|'' | | ''Input Data'' | ||
| | | Folder where to find the feature data and the set of features to be mapped. Note that the input folder and all its sub-folders are included. | ||
|- | |- | ||
| ''Color Range Minimum'' | |||
|'' | | Color to which the minimal value of each selected feature is mapped. Between the minimal and maximal color a linear interpolation of values takes place. | ||
| | |||
|- | |- | ||
| ''Color Range Maximum'' | |||
|'' | | Color to which the maximal value of each selected feature is mapped. Between the minimal and maximal color a linear interpolation of values takes place. | ||
| | |||
|- | |- | ||
|'' | | ''Minimal Size Threshold'' | ||
| | | Threshold on the size of the regions to be considered; smaller regions are excluded. The unit for the threshold is the same as the unit of the region areas in the feature files. | ||
|- | |- | ||
| ''Maximal Size Threshold'' | |||
|'' | | Threshold on the size of the regions to be considered; larger regions are excluded. The unit for the threshold is the same as the unit of the region areas in the feature files. | ||
| | |||
|} | |} | ||
===== Output Parameters ===== | ===== Output Parameters ===== | ||
Revision as of 18:26, 13 February 2020
FeatureColorMapper Plugin
Short Description
The FeatureColorMapper allows to map feature values extracted for regions in an image onto corresponding label images for visualization.
The features values (like for example extracted by the PaCeQuant plugin) have to be provided as CSV files.
The mapper allows to select a set of features, and for each feature color maps with user-defined colors showing the overlay
of region-specific feature values over the image regions are saved to individual folders on disk.
Release Notes
The FeatureColorMapper is available in MiToBo since release version 1.8.17.
Related Publication
When using the mapper, please cite us:
- B. Möller, M. Glaß, D. Misiak, and S. Posch, MiToBo - a toolbox for image processing and analysis. In Journal of Open Research Software, 4(1):e17, 2016.
Name of Plugin/Operator
de.unihalle.informatik.MiToBo.apps.cellMorphology.FeatureColorMapper
(available since MiToBo version 1.8.17)
Main features
- allows to map region features, for example cell features extracted by PaCeQuant, in heatmap style to image regions
- the color map can be configured by the user in terms of colors used for minimal and maximal values
- multiple features can be mapped in a single plugin run
- a range of valid region sizes can be specified to exclude too small or too large regions from processing and mapping
Usage
To run the plugin perform the following steps:
- install MiToBo by following the instructions on the Installation page
- run MiToBo and start the operator runner by selecting the menu item MiToBo Runner from Plugins -> MiToBo
- in the selection menu navigate to de.unihalle.informatik.MiToBo.apps.cellMorphology and select the operator FeatureColorMapper
This will bring up the operator window of the mapper (see figure on the right, top) where the basic configuration parameters can be specified.
You first need to select a folder where the mapper can find feature data that should be mapped. Select the folder using the Choose... button. After selecting a suitable directory, press the Load button . The mapper will search for files with CSV feature data and parse the first of these files to figure out which features are present. These will be listed in the Column(s) to map menu below and can be selected for mapping by the user.
Once the desired features are selected you can specify the color range that should be used and minimal and maximal size thresholds for regions to be considered.
Press the Run button to start the operator.
Input Parameters
| Parameter Name | Explanation |
| Input Data | Folder where to find the feature data and the set of features to be mapped. Note that the input folder and all its sub-folders are included. |
| Color Range Minimum | Color to which the minimal value of each selected feature is mapped. Between the minimal and maximal color a linear interpolation of values takes place. |
| Color Range Maximum | Color to which the maximal value of each selected feature is mapped. Between the minimal and maximal color a linear interpolation of values takes place. |
| Minimal Size Threshold | Threshold on the size of the regions to be considered; smaller regions are excluded. The unit for the threshold is the same as the unit of the region areas in the feature files. |
| Maximal Size Threshold | Threshold on the size of the regions to be considered; larger regions are excluded. The unit for the threshold is the same as the unit of the region areas in the feature files. |
Output Parameters
... coming soon
Sample data
... coming soon